The Capital Asset Pricing Model (CAPM) calculates the expected return on equity of an individual company. It is based on the expected rate of return on the market, the risk-free rate and the beta coefficient of an individual security or portfolio.

Where,
Re: Return on Equity
Rf: risk-free rate
E(Rm): expected rate of return on market, and
β: beta coefficient.
E(Rm)-Rf: the difference between the expected market rate of return and the risk-free rate, is known as the market premium.
Total risk to a stock can be divided into two parts: systematic rate (the risk associated with market and cannot be diversified away) and unsystematic risk (the risk inherent to the stock and can be eliminated through diversification). Beta is a measure of systematic risk of a stock. Beta describes the sensitivity of a stock’s returns to the changes in the market. An asset with a beta of zero means its return is independent of changes in the market return.
Beta = Covariance of stock to the market / Variance of the market
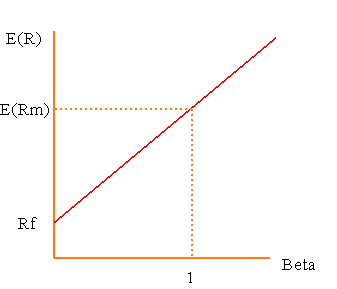
The Security Market Line (SML) is essentially a graph representation of CAPM formula. It plots the expected return of stocks on the y-axis, against beta on the x-axis. The intercept is the risk free rate and the slope represents the market premium. Individual securities’ expected return and risk are plotted on the SML graph. For one security, if it is plotted above the SML, it is undervalued as the investors are expecting a greater return for the same amount of risk (beta). If it is plotted below the SML, it is overvalued as the investors would accept a lower return for the same amount of risk (beta).

Security Market Line
